One of the most powerful tools for a trader is Divergence. You cannot start your trading journey without knowing how to spot and use divergence indicator. But first of all, you must understand it.
Divergence is spotted by comparing price action to an indicator. It can be the RSI, MACD, Stochastic or any other suitable indicator (usually oscillators). Price and indicators usually move together – price goes up and the same is seen in the indicator; price comes down, the indicator comes down. But sometimes, the indicator doesn’t match the movement of price. Price makes a higher high, but the indicator fails to rise to new highs; instead it just forms a lower high. This is Divergence and a sign that price will possibly come down.
Divergence Indicator
Divergence is identified by comparing two Highs or Lows of price with the corresponding ones on the divergence indicator. There are two types of divergence: regular and hidden. Next we are going to talk about both of them:
- Regular bullish divergence forms when price makes Lower Lows, but the indicator makes Higher Lows. This signals a possible bottom and a trend reversal.
- Regular bearish divergence forms when price makes Higher Highs, but the indicator makes Lower Highs. This signals a possible top and a trend reversal.
- Hidden bullish divergence forms when price makes Higher Lows, but the indicator makes Lower Lows. This is indicative of a possible trend continuation.
- Hidden bearish divergence forms when price makes Lower Highs, but the indicator makes Higher Highs. This is indicative of a possible trend continuation.
Try to spot divergences on the charts using the classification from above. It will be hard in the beginning, but you will get used to it eventually and you will see that Divergence can be a great help.
 No matter how good an divergence indicator, a pattern or any trading tool is, don’t use it by itself and try to confirm your signals with some other type of analysis. You can do this by using confluence. Confluence forms in a spot where you have more than one indication of where price will go. For example, confluence occurs where price reaches a confirmed horizontal level of support or resistance and a confirmed trend line. This is a two point confluence. If in that point, you see divergence forming, confirming your direction, you will have a stronger signal and a higher probability of price going your way. Here is an example:
When price touched the trend line, it also touched the resistance level. Add to that the hidden bearish divergence on the RSI and the fact that the RSI is almost reaching overbought territory and you have a good short trade. You must understand that these are just examples and that price sometimes doesn’t go your way no matter how much confluence you have when you enter the trade.
It never hurts to have extra confirmation when you enter a trade and you should always make decisions based on several factors.

 First and foremost, do not be misled by the fact that support and resistance come in various forms; this subject matter is actually a lot simpler than it may seem at a first glance. For example, any experienced trader has realized that certain assets can only be pushed so far in a single direction, regardless of how hard they try to influence their price. If the price of an asset has some serious difficulties climbing past a certain point, and cannot seem to achieve this, then this may in fact be its resistance level. Or, if it cannot seem to fall below a certain price, we are talking about a support level. When analyzing charts, support and resistance levels are often referred to as a floor or a ceiling respectively, mostly because this is as far as prices will go. Also, do not take these things for granted, as support and resistance are not set in stone and will get breached – eventually. Rather, the support and resistance level of a certain asset can be moved in accordance with market conditions.
 These barriers can and do change with time, and what directs those changes are general trends. This is why trends and trendlines are just as important as support and resistance, especially for rookies who have yet to get their bearing in the industry. As markets trend upwards, resistance levels become stronger as traders slow down, expecting the price to fall down towards previously established borders. This “plateau” effect can be discussed further at another time, but it involves prices standing relatively still or even dropping slightly, before a new resistance level is established, as the market stabilizes yet again. Needless to say, support levels work in the exact same manner, except the price in this process goes down, rather than up. As the actual price gets closer to the perceived support level, the trading gears up toward short positions, expecting the prices to recover in the near future. When applied to a chart, the line that signifies the price will peak either at the upside or a downside; connecting these peaks is how a trendline is formed, and it is used as a general indicator as to whether the price is expected to rise or fall. However, in spite of their objectivity and accuracy, the fact that the use of trendlines is so widespread these days can often lead to problems of its own, as people start relying on these things too much and leave their positions vulnerable to traders who can think outside the box.
 First one we already mentioned – the experience. Managed forex accounts come with brokers who have proven long-term trading involvement. The second thing to consider is pressure. Make no mistake, trading can be both frustrating and exhausting. Letting your emotions take over is a safe way to the abyss. You don’t want to do that. Instead, it’s better to rely on managed forex accounts and traders who make rational decisions when pressure comes into the game. Finally, ask yourself the following questions – Do you really want to become a trader? Are you willing to reshuffle your time and transfer a significant part of it to build your trading mindset. Will you stay commited to it? If motivation as well as clear objectives lack, forget it. Managed forex accounts are the way to go.

 Now, think about how many trades could be entered by a trader that uses the 1 and 5 minute chart and just aims for 3-5 pips profit and exits his trades in less than 5 minutes. The amount of trades can be huge during the course of one day. This fast paced way of trading is called “Forex Scalping” and it can bring a lot of profit, but also it requires a lot of concentration and constant monitoring of the trade. Profits come from the amount of successful trades, even if the profit from one or two trades is insignificant and that’s why a trader must be constantly in front of his computer.


 The importance of Fibonacci trading lies in the fact that it can help you identify the exact places for some strategic transactions, or indicate where to place a target price or a stop loss. If you want to boil down modern trading to raw science, Fibonacci series is a good start.
 For starters, the MACD indicator is based on a relationship between two moving averages of prices – an average closing price of an instrument over a period of time that keeps moving one day at a time, hence the name ‘moving average’. If you factor in the importance of recent data and assign them more weight, you get an exponential moving average, or EMA. These moving averages are calculated for different periods, usually 12 and 26 days, and if you subtract the 26-day from the 12-day EMA, you get your MACD indicator.
 Stochastic indicators work under the assumption that the closing price of an asset is linked to highest and lowest prices in the 5-day period (for the K line and 3-day period for the D line, see the second picture). Stochastic models can be used to estimate probability of an outcome when one or more variables are unknown. Statistically speaking, any outcome comes with a certain probability and this type of analysis is great for risk management.

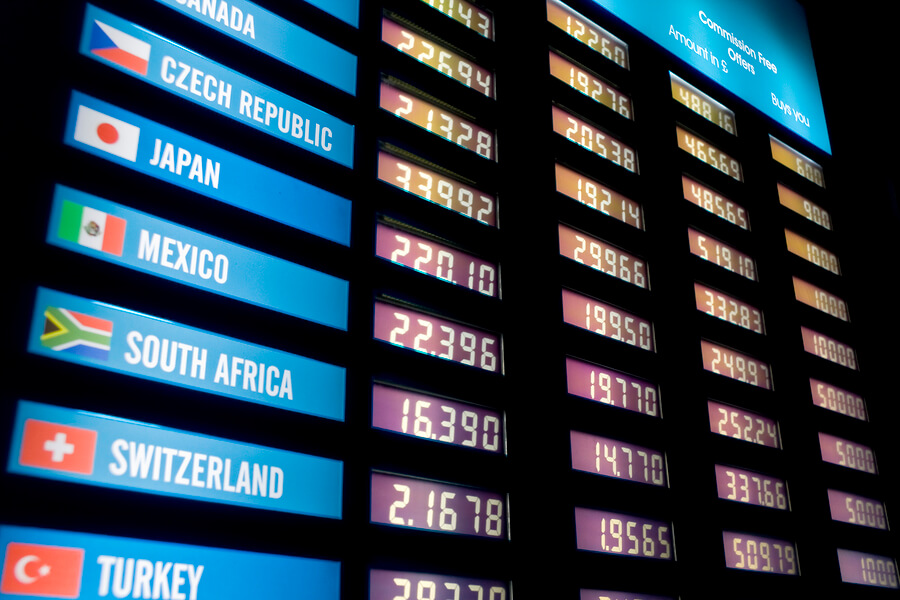
 In simple terms, try to think of Forex exchange rates as the price of one currency, except it is in another currency – say, the price of Euros in U.S. currency in. The value of a single euro in U.S. dollars would be something like 1.13172. In other words, if the price of the EUR/USD pair is 1.13172 it means that is how many dollars you would get on a single Euro. Of course, bid and ask prices would also have to be factored in. But the point is, Forex exchange rates are what determines how much money you will make, or whether you will make any at all.
 Thanks to the effects of globalization, all of the markets in the world are interconnected, for better or worse. Whatever happens, anywhere in the world could potentially affect you and your bottom line, which is why Forex rates today are such a pain to deal with. You see, the value of a currency is far more complicated to be explained by a simple formula such as economy + supply/demand = value. Forex exchange rates do not work that way.
 Currency swaps are the most obvious, if a bit crude, type of derivatives. Basically, the two parties exchange some currency on the spot and agree to switch back after a while. Usually there is some sort of collateral on the side. If used wisely, this strategy can ensure you can “safely” store your currency until a later date. Your loss is someone’s gain and vice versa, but that is how Forex currency exchange works, does it not?
 When employed properly, hedging strategies, Forex or otherwise, can result in anything from a deal going through with minimal losses to the deal falling through completely, but the trader still breaks even. If the Forex hedging is not done properly those losses could be huge. Still,
  For instance, getting a currency option on the same pair could ensure there is a safe point, in case the spot market decides to throw a tantrum. If the spot price is more favorable, the option will expire worthless, but the income should easily offset the fee for the option. Otherwise, the trader will activate the option and recoup some of the losses, if not all. The problem with this strategy is getting your hands on the right option, as someone needs to be willing to share the risk. The fee may be too great in case the trader gets too greedy.
 First and foremost, in order to apply hedging strategies, they need to be able to assess the risks they are facing. As well as to figure out whether a risk is even worth hedging! If a trade is too costly to hedge and too risky to follow through unchecked, then the best course of action may well be to move along and wait for a better opportunity. Then again, if risk assessment is done poorly, that better opportunity may never come, as the trader will not be able to recognize it.